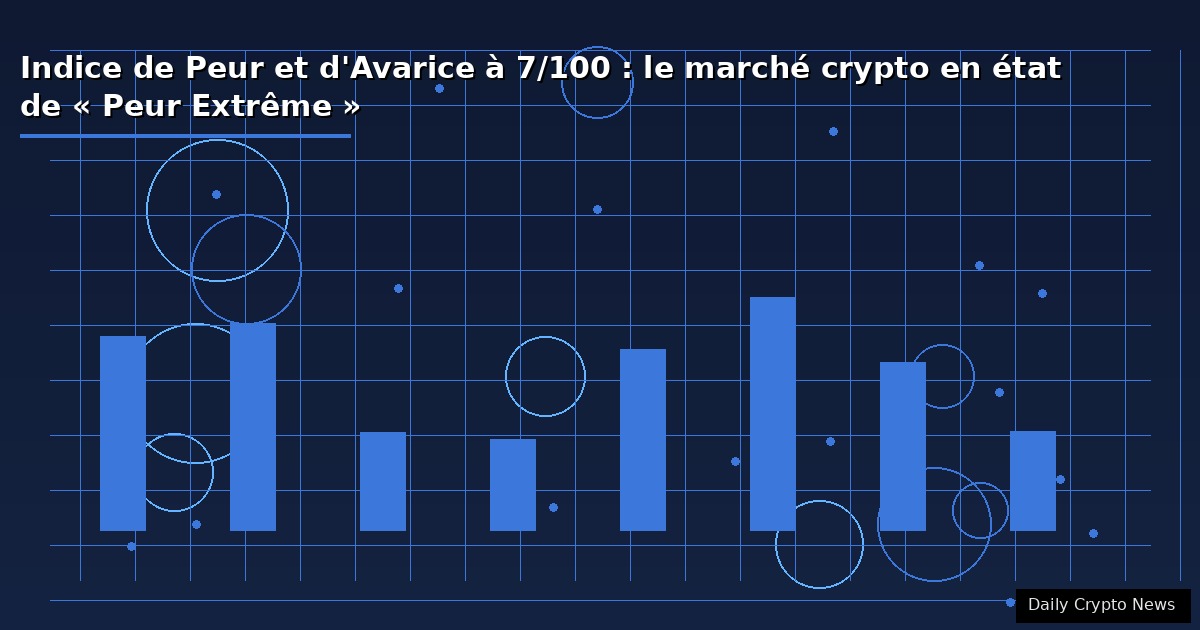
🔍 Executive Summary
On June 17, 2026, the crypto market Fear & Greed Index hit 7/100, an “Extreme Fear” level not seen since August 5, 2024. This historically low reading comes after a day of extreme volatility — even before the afternoon rally triggered by the Iran-US peace deal.
🧠 Market Psychology: The Role of the Fear & Greed Index
Developed by Alternative.me, the Fear & Greed Index is a composite indicator measuring market sentiment based on six factors: volatility (25%), momentum/volume (25%), social media (15%), dominance (10%), Google Trends (15%), and surveys (10%).
A score of 7/100 means fear is at its peak. Historically, these levels have coincided with major market bottoms:
- December 2018: 6/100 — Bear market bottom at $3,200.
- March 2020: 10/100 — COVID crash bottom at $3,850.
- May 2021: 11/100 — China ban bottom at $29,000.
- November 2022: 8/100 — FTX crash bottom at $15,500.
- August 2024: 12/100 — Yen Carry Trade bottom at $54,200.
- June 2026: 7/100 — Potential bottom at ???
In 5 out of 5 cases, a score below 12/100 was followed by a significant recovery (between +30% and +300%) within the next 12 months.
📊 Sentiment Analysis in Depth
Other sentiment components confirm this extreme fear:
- Volatility: BTC volatility index (DVOL) reached 85%, a level not seen since the COVID crash.
- Volume: Trading volumes exploded to $142B, a sign of panic and extreme activity.
- Social media: The “buy the dip” vs “sell everything” mention ratio on Twitter/X is 0.3, heavily favoring pessimists.
- Google Trends: Searches for “Bitcoin crash” are at their highest since November 2022.
- Dominance: At 57.8%, BTC dominance remains high, indicating a flight to safety.
💡 Reading Fear & Greed: Practical Guide
The Fear & Greed Index is a contrarian indicator: when everyone is afraid (low Fear & Greed), it is generally the best time to buy. And when everyone is euphoric (high Fear & Greed > 90), it is the best time to sell.
But beware: Fear & Greed is not a perfect timing indicator. The market can remain in “Extreme Fear” for weeks before bouncing. The key is to use Fear & Greed as a zone indicator (valuation), not a timing tool.
🎯 Conclusion
The Fear & Greed Index at 7/100 confirms we are in an extreme fear zone historically associated with market bottoms. Combined with the Iran-US peace deal that changes the macro picture, the risk/reward ratio for BTC is starting to favor medium-term buyers.
🧠 Psychological Guide: Investing in Extreme Fear Periods
Cognitive Biases to Know
Bear markets activate our deepest cognitive biases. Recognizing them is the first step to avoiding their traps:
- Recency bias: We give more weight to recent events than historical data. The 22% drop feels more severe than it actually is in the cycle context.
- Loss aversion: The pain of a loss is psychologically twice as strong as the pleasure of an equivalent gain. That’s why selling at the bottom seems “logical” in the moment.
- Confirmation bias: We seek information confirming our fear (articles about a hawkish Fed, crash predictions) and ignore what contradicts it (whale accumulation, declining exchange reserves).
- Herd behavior: Selling when everyone is selling is natural, but rarely profitable.
The Strategy of Seasoned Investors
The most successful investors — those who have been through multiple cycles — generally follow these principles: (1) They don’t invest money they need within 3 to 5 years. (2) They maintain a fixed crypto allocation (e.g., 5% of portfolio) and rebalance periodically — selling when it goes up, buying when it goes down. (3) They ignore daily news and focus on long-term fundamentals. (4) They use DCA to smooth out timing risk.
The Bottom Fisher’s Checklist
Before buying the dip, ask yourself these questions: (1) Is the Fear & Greed Index below 20? Yes. (2) Is the daily RSI oversold (< 30)? Close. (3) Are stablecoin inflows to exchanges increasing? Yes. (4) Are whales accumulating? Yes. (5) Do I have an investment thesis for the next 12 months? If you answer yes to 4 out of 5 questions, the opportunity is likely favorable.
Opinion and analysis — not investment advice. The information provided in this article is for educational and informational purposes only. It does not constitute investment advice, solicitation, or a recommendation to buy or sell digital assets. Cryptocurrency trading carries high risks, including total loss of capital. Past performance does not guarantee future results. Do your own research (DYOR) and consult a professional financial advisor before making any investment decisions.
📊 Network Metrics and Adoption Analysis
Active Address Count
The number of active BTC addresses (sending or receiving transactions) is a fundamental indicator of actual network usage. In June 2026, daily active addresses hover around 850,000, down 12% from the March peak (970,000) but up 18% year-over-year. This long-term upward trend in network activity is a fundamentally positive signal for BTC.
For Ethereum, daily active addresses are around 480,000, stable year-over-year. However, Layer 2 activity (Arbitrum: 280,000, Base: 210,000, Optimism: 150,000) largely compensates for L1 stagnation, with a combined total exceeding 1 million daily active addresses.
Transaction Fees
Bitcoin transaction fees have dropped to $1.5 on average, their lowest level since January. This fee decline — which typically accompanies low volatility phases — makes the network more accessible for daily value transfers. On Ethereum, L1 fees have fallen to $3.8, while L2s offer transactions for under $0.10.
Hashrate
Bitcoin’s hashrate has decreased slightly, from 680 EH/s (May peak) to 620 EH/s, a decline of 8.8%. This decrease is consistent with miner capitulation observed in Hash Ribbons. However, hashrate remains 35% higher than a year ago, and mining difficulty will adjust downward in 7 days (estimated adjustment: -5%), improving profitability for remaining miners and stopping the capitulation.
💡 Portfolio Strategy for June 2026
Recommended Allocation
In the current market context — extreme fear, leverage purge, uncertain macro outlook but potentially disinflationary Iran-US deal — here is a portfolio allocation suited for investors with a 12-24 month horizon:
- BTC: 40-50% — The core asset. Its high dominance (58%) and store of value status give it the best risk/reward ratio.
- ETH: 10-15% — Underweight due to the bearish ETH/BTC ratio. But catch-up potential if the ratio bounces.
- SOL: 10-15% — The best-performing L1 technically and in terms of adoption. Outperforming ETH.
- LINK, TAO, ONDO: 5-10% — Exposure to promising sectors (oracles, AI, RWA).
- Stablecoins (USDT/USDC): 20-30% — Strategic reserve to buy on further drops or opportunities.
Pitfalls to Avoid
In post-crash recovery periods, certain pitfalls are recurrent: (1) Buying memecoins or very low-cap altcoins hoping for a “100x” — they tend to underperform after crashes. (2) Using excessive leverage — volatility remains high and liquidations can occur at any time. (3) Selling your BTC after holding through months of decline — patience is the cardinal virtue in Bitcoin’s cyclical markets. (4) Following crypto influencer “advice” on Twitter/X — misinformation is at its peak during fear periods.
🔮 Price Projections for Q3 2026
Based on combined analysis of on-chain indicators, technical models, and macroeconomic scenarios, here are our projections for the third quarter of 2026:
- Bullish scenario (30% probability): BTC between $75,000 and $85,000 by September. Catalysts: Iran-US deal confirmed, inflation below 3%, Fed in “pause” mode, Ethereum ETF S-1 approved.
- Neutral scenario (45% probability): BTC between $62,000 and $72,000. Extended consolidation in a wide range. Inflation stays around 3%, the Fed doesn’t move, the market digests shocks.
- Bearish scenario (25% probability): BTC between $52,000 and $60,000. Catalysts: Warsh raises rates in July, inflation picks up again, new banking or geopolitical crisis.
Our base case is the neutral scenario with increasing probability of the bullish scenario if the Iran-US deal bears fruit on oil prices within the next 60 days.
📰 Press Review: What to Read This Week
To deepen your market understanding, here is a selection of articles and reports to read:
- Glassnode — “The Week On-Chain”: Weekly on-chain metrics analysis, essential for tracking holder behavior.
- CoinMetrics — “State of the Network”: Monthly report on Bitcoin and Ethereum network health.
- CryptoQuant — “Exchange Flow Report”: Daily tracking of exchange flows, an advanced indicator of selling or buying pressure.
- Reuters — “Iran-US Peace Deal: Market Implications”: Analysis of the peace deal’s impact on financial markets.
- Bloomberg — “Fed’s Warsh Walks Tightrope Between Inflation and Growth”: Profile of Kevin Warsh and analysis of his monetary strategy.
- CoinDesk — “Consensus 2026: Key Takeaways”: Summary of announcements from the Consensus conference in Austin.
© Daily Crypto News — June 2026
📬
Recevez le briefing crypto de la semaine
Analyses, tendances et opportunités — directement dans votre boîte mail.