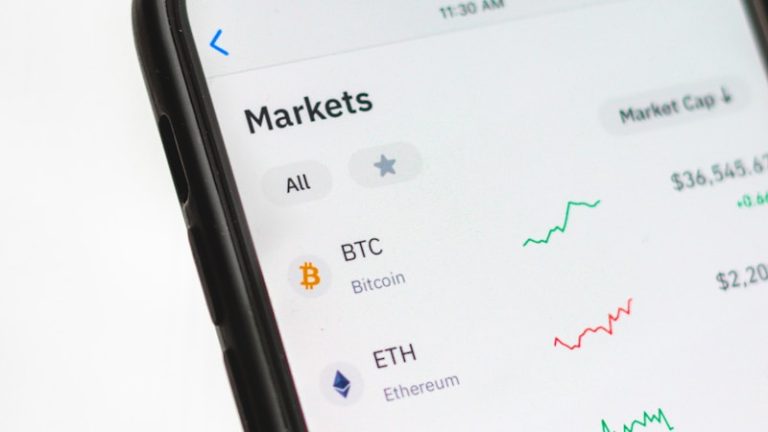
Sunday, July 19, 2026, will remain a pivotal date for global financial markets. As Bitcoin already struggled to maintain its momentum above $64,000, the military escalation between the United States and Iran brutally reminded investors that geopolitics remains the number one risk factor for digital assets. Within hours, BTC dropped back below $62,500, dragging the entire crypto market down with it and wiping out the modest gains accumulated since the start of the week.
This analysis provides an in-depth look at the mechanisms at play, the implications for investors, and the short- to medium-term outlook for Bitcoin amid one of the most significant geopolitical shocks since the onset of the Ukraine conflict.
🇮🇷 The Geopolitical Shock: Strikes That Change the Game
What analysts are now calling “Black Sunday in July” began with the announcement of new US military strikes on Iranian positions. The United States Central Command (CENTCOM) confirmed a fresh wave of strikes targeting Iranian military installations, while Iran immediately retaliated with drone strikes against US positions in the region. The fragile truce that seemed to be taking hold in the Middle East after months of indirect negotiations has shattered, plunging the region back into total uncertainty.
The timing of this escalation is particularly concerning for markets. It comes as investors are already digesting a series of disappointing corporate earnings — led by Netflix, which fell more than 10% to its lowest level since August 2024. The combination of a geopolitical shock and underlying weakness in tech stocks creates a “double whammy” that spares no risky asset.
For markets, the effect was immediate and violent. The Nasdaq Composite fell nearly 2% at the Wall Street open. Technology stocks, already under pressure, suffered another wave of heavy selling. Crude oil (WTI) surged more than 4%, breaking above the $85 per barrel mark, while the US dollar strengthened 0.8% against a basket of currencies — a classic “flight to safety” movement that penalizes risky assets, including cryptocurrencies. Gold, traditionally seen as a safe haven, also rose 1.2%, confirming the widespread nature of risk aversion.
📉 Bitcoin Below $62,500: Complete Technical Breakdown
Bitcoin hit an intraday low of $62,065 before modestly rebounding toward $63,200, erasing the gains of the previous three days. This sharp rejection at the three-week highs confirms that BTC does not yet have the strength to break out of its summer consolidation range — a range that has now lasted for nearly two months.
From a technical standpoint, several key levels structure the current battleground:
- Major support: $60,000. This psychological threshold held during previous tests (early June and mid-July). A clean break below would open the path to $57,000, or even $55,000, where the 200-week moving average sits — a historically relevant level for long-term accumulation.
- Immediate resistance: $64,500. The local high reached just before the Iran shock. Without a major bullish catalyst (rate cut, de-escalation, ETF inflows), breaking through this level in the near term will be difficult.
- Moving averages: The daily MA50 at $63,800 was lost during the drop. The MA100 at $61,500 is the next dynamic level to defend. The MA200 at $58,200 remains the last line of defense before a confirmed bear market on weekly timeframes.
- RSI (14 days): At 42, it shows clear weakness but has not yet reached oversold territory (30 and below). A drop below 30 would historically be a powerful contrarian buy signal — as was the case in November 2022 and August 2024.
- Ichimoku Cloud: The Tenkan-sen (fast moving average) crossed below the Kijun-sen (slow moving average), forming a short-term bearish signal. However, the weekly cloud remains bullish, indicating that the long-term trend is not yet broken.
- Bollinger Bands (20,2): The bands are widening, a sign of rising volatility. The price is testing the lower band, which has often preceded technical bounces in the past.
Analyst Rekt Capital noted on X that Bitcoin’s long-term downtrend may be entering its final phase, suggesting that “the market always repeats the same patterns.” He compares the current structure to what was observed before the 2023 rallies, with a long consolidation range followed by a bullish breakout. A perspective tempered by trader Daan Crypto Trades, who describes the current action as “typical summer stuff”: “A few days up, a few days down. Nothing really meaningful anywhere.”
Trader Jelle, meanwhile, remains optimistic and sees this range as an opportunity for a “relief rally” in the weeks ahead before a possible deeper correction in October. He notes that the lows of the range are holding well, which is bullish for a “higher low” formation.
💰 The Freeze of $131M in Crypto Linked to Iran: A Strong Signal for the Industry
Alongside the military strikes, an equally significant event unfolded in the crypto ecosystem. The US Treasury, through Secretary Scott Bessent, ordered the freezing of over $130 million in cryptocurrencies held in wallets linked to Iran. Blockchain investigator Specter identified that Tether had frozen four Tron wallets containing $131 million in USDT, confirmed as assets tied to the Central Bank of Iran.
“The US Treasury is committed to disrupting and degrading Iran’s illicit financial activities, including its abuse of digital assets,” Bessent said on X. “We will continue to aggressively follow the money and deny the Iranian regime access to the proceeds of its illicit revenue schemes.”
This operation is part of Operation Economic Fury, a massive financial pressure campaign launched in March 2025 by the Trump administration. According to Bessent, the operation has already seized approximately $1 billion in Iranian crypto assets. In April, Tether had already frozen $344 million in USDT at the request of US authorities, bringing the total of Iran-related freezes to nearly half a billion dollars in 2026 alone.
According to a report from TRM Labs, Iran-linked entities have transacted no less than $3.8 billion through the CoinEx platform, demonstrating the scale of crypto financial flows used by the Iranian regime to circumvent international sanctions.
⚔️ War and Crypto: A Confirming Correlation — Macro Analysis
The impact of the Iranian strikes on Bitcoin illustrates a trend that has been strengthening since 2022: the growing correlation between cryptocurrencies and traditional risky assets (tech stocks, Nasdaq, S&P 500). Far from being a de-correlated “safe haven,” Bitcoin now reacts like a high-beta asset during periods of geopolitical tension. This correlation, which regularly reaches 0.6 to 0.7 with the Nasdaq, is a byproduct of the massive institutionalization of the crypto market.
Several structural factors explain this rising correlation:
- Market institutionalization. With the arrival of spot Bitcoin ETFs in January 2024, institutional funds can now enter and exit the market as easily as they do the Nasdaq. In times of stress, managers liquidate their most liquid and profitable positions — and Bitcoin, with its daily volumes in the billions, is one of them. Spot Bitcoin ETFs indeed recorded net outflows on Sunday, reversing a positive week.
- The credit cycle. Geopolitical tensions mechanically tighten financial conditions. Banks become more cautious, risk premiums rise, and credit contracts. In this environment, speculative assets — those without cash flows or fundamental valuations — are the first to suffer.
- The wealth effect. Falling stock prices reduce investor portfolio values, which mechanically limits their risk appetite and therefore their allocation to crypto. This is a second-round effect that can last for weeks.
- The strong dollar. Geopolitical crises strengthen the US dollar (the ultimate safe haven), which exerts direct downward pressure on the dollar-denominated price of Bitcoin. The inverse BTC/DXY correlation remains one of the most reliable macro indicators.
- Global liquidity. The Fed’s quantitative tightening (QT), combined with rising long-term interest rates, reduces the overall liquidity available for risky assets. When liquidity retreats, Bitcoin is often one of the first assets to correct.
However, it would be wrong to view Bitcoin as merely a “proxy for the Nasdaq” or just another risky asset. While the short-term correlation is real and measurable, the long-term dynamics remain fundamentally different. Bitcoin retains unique qualities: a fixed and incompressible supply (21 million), absolute decentralization, censorship resistance, and cross-border portability — attributes that become all the more valuable in times of conflict and geopolitical uncertainty. It is precisely in these moments that the value of the “financial sovereignty” offered by Bitcoin takes on its full meaning.
🏛️ The Regulatory Context: GENIUS Act, Warren/Trump, and Stablecoin Regulation
This crisis comes amid a rapidly evolving US regulatory landscape. Federal agencies have just missed the deadline of the GENIUS Act — the stablecoin law — to finalize implementing rules. In its first year of existence, only 10 proposed rules have been issued, far below market expectations. The stablecoin market ($180+ billion market cap), which is precisely at the heart of the $131 million Iranian freeze, remains in a legal vacuum that is worrying for regulators.
Senator Elizabeth Warren, a leading figure among anti-crypto regulators, sent a letter to President Donald Trump demanding full disclosure of his crypto income for 2026. This request follows the revelation that the president holds $1.4 billion in digital assets, raising questions about potential conflicts of interest as the Senate considers a bill on crypto market structure. This matter could have major political repercussions and influence the legislative calendar.
On the exchange side, OKX Europe announced it would allow users to convert their USDT into MiCA-compliant USDC — a decision that takes on full meaning in the current context of USDT freezes linked to Iran. Regulated and transparent stablecoins (such as Circle’s USDC, which publishes monthly reserve attestations) could significantly gain market share at the expense of Tether, which is perceived as more exposed to freeze and sanctions risks.
🌍 The Crypto Ecosystem’s Response and Positive Institutional Signals
Despite this bearish backdrop, several positive signals deserve mention. Banking giant HSBC, through its HSBC Orion division, received approval from the Bank of England to enter the UK’s Digital Securities Sandbox (DSS) — a first for a traditional bank of this size. This decision marks a major step in the institutional adoption of tokenization of financial assets, a market analysts believe could reach $16 trillion by 2030.
Meanwhile, Galaxy Digital signed a 15-year naming rights agreement with Texas Tech’s stadium, one of the largest crypto sponsorship deals in US college sports. These signs of long-term adoption contrast with short-term volatility and remind us that crypto infrastructure continues to develop independently of price cycles.
In Europe, France’s National Gaming Authority (ANJ) ordered internet service providers to block access to Polymarket, the decentralized prediction market, for “illegal gambling and result manipulation.” This decision, which comes amid Polymarket’s explosive growth (particularly thanks to bets on elections and geopolitical events), adds to an increasingly restrictive European regulatory climate for decentralized finance, although the MiCA framework finally offers some regulatory clarity.
🔮 Scenarios and Outlook for the Weeks Ahead
As the weekend looks set to be particularly volatile — with traditional markets closed but crypto trading active 24/7 — several scenarios are emerging for Bitcoin:
Scenario 1 — Bearish (probable in the short term): If the strikes intensify and the conflict escalates to a regional level, Bitcoin could test $60,000 in the coming days, or even $57,000–$55,000 in the event of widespread panic. Spot Bitcoin ETFs would likely see massive outflows on Monday. The “50-day bottom counter” mentioned by Rekt Capital would be reset.
Scenario 2 — Neutral (most likely): Bitcoin remains within its $60,000–$65,000 range, digesting the geopolitical shock as it has digested previous ones (COVID-19 in 2020, the Russia-Ukraine conflict in 2022, the banking crisis in 2023). The market awaits the next catalyst: the Fed meeting at the end of July, inflation figures (PCE), or developments in the conflict.
Scenario 3 — Bullish (surprise): A rapid de-escalation — whether diplomatic or due to exhaustion on both sides — would trigger a powerful “relief rally.” Bitcoin could climb back toward $68,000–$70,000 in a few days. The massive call options open at $72,000 for late July, spotted by CoinDesk analysts, indicate that some institutional traders are precisely anticipating this scenario.
The Federal Open Market Committee (FOMC) meeting scheduled for July 28–29 will be the next major macro event. If Jerome Powell strikes a dovish tone — signaling that geopolitical risks justify a pause in tightening — it could support risky assets. A hawkish Fed combined with further military escalation would, however, be the worst-case scenario for Bitcoin.
💡 Lessons for Investors: What to Take Away from This Day
The day of July 19, 2026 will go down in the annals as a brutal reminder of the geopolitical risks that hang over crypto markets. It teaches several fundamental lessons:
- Diversification is not optional. Even Bitcoin, the most liquid and “safe” of digital assets, can lose 5% to 10% in a few hours on a geopolitical announcement. A crypto portfolio must include defensive allocations (stablecoins, tokenized gold like PAXG or XAUT, lending protocols) to weather such shocks.
- Stablecoins are not risk-free. The freezing of $131 million in USDT linked to Iran demonstrates that even the largest stablecoins can be blocked by government decision. Tether’s centralization, which allows it to freeze addresses at the request of authorities, is a sword of Damocles hanging over the market.
- Macroeconomics and geopolitics have become unavoidable. Ignoring correlations with traditional markets, Fed monetary policy, and international tensions means trading with a blindfold on. The “crypto maxis” who claimed Bitcoin was de-correlated from traditional markets have been contradicted by the facts.
- Crises create opportunities. Bitcoin’s biggest historical returns came after similar shocks: +900% after COVID-19, +150% after the start of the war in Ukraine. The key is to have liquidity available when markets panic.
- Time horizon is crucial. For a long-term investor (4 years and beyond), these short-term fluctuations are noise. Bitcoin has always outperformed all asset classes over 4-year periods. The question is: do you have the conviction to endure these periods of extreme volatility?
📊 In Summary — Key Figures for Sunday, July 19, 2026
| Indicator | Value | Variation / Detail |
|---|---|---|
| Bitcoin (BTC) | $62,065 – $63,200 | -2.5% over 24h |
| BTC 24h Volume | ~$28 billion | +65% vs. average |
| Nasdaq Composite | Open -2% | Worst session since May |
| WTI Crude Oil | $85+ / barrel | +4% on the day |
| DXY (dollar index) | +0.8% | Flight to safety |
| USDT frozen (Iran) | $131 million | 4 Tron wallets |
| Total seized Op. Economic Fury | ~$1 billion | Since March 2025 |
| Spot Bitcoin ETFs (net flows) | Estimated outflows | Reversal of the week |
| BTC key support (short term) | $60,000 | Psychological level |
| BTC major support | $57,000–$58,200 | MA200 / structure |
| BTC immediate resistance | $64,500 | Local pre-crisis high |
As the weekend begins, traders hold their breath. The Middle East is a powder keg where every new strike can shake global markets. But in adversity, crypto has always bounced back — stronger, more resilient, and more adopted than before. The story of Bitcoin is not written in days or weeks, but in 4-year cycles. And if history is any guide, the best purchases are made in moments of maximum fear.
⚠️ Opinion and analysis — not investment advice
This article is provided for information and analysis purposes only. It does not constitute investment advice, solicitation, or a recommendation to buy/sell digital assets. Cryptocurrencies carry high risks — only invest what you can afford to lose. Always do your own research (DYOR) before any financial decision.
This article is not sponsored.
📬
Get the weekly crypto briefing
Analysis, trends and opportunities — straight to your inbox.