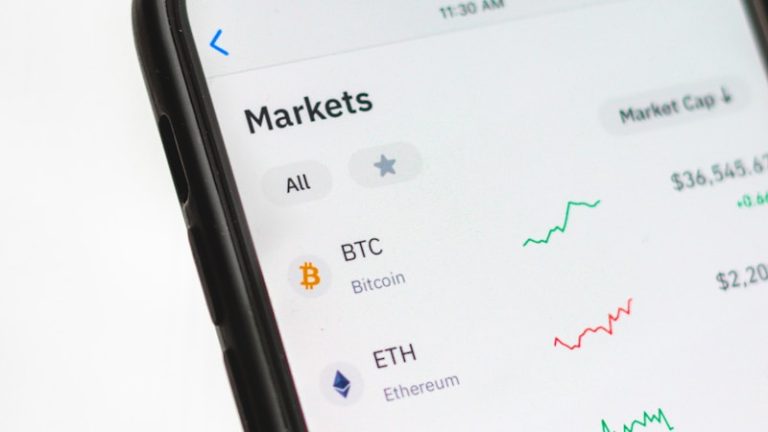
Bitcoin has just erased all its late-June losses, climbing back above the psychological threshold of $63,000. Meanwhile, the Fear & Greed Index remains stuck in “Extreme Fear” territory — a striking contrast that divides analysts between a generational buying opportunity and a mere technical bounce before renewed macroeconomic turbulence.
After hitting a low of $59,500 on June 6, bitcoin has embarked on a gradual recovery that brought it back above $63,000 over the weekend of July 5. This rebound coincides with a return of inflows into U.S. spot Bitcoin ETFs, which recorded over $200 million in daily net inflows for the first time since May.
The Fear & Greed Index at Its Lowest: Buy Signal or Cause for Caution?
The Crypto Fear & Greed Index, which measures market sentiment on a scale from 0 (Extreme Fear) to 100 (Extreme Greed), is currently oscillating around 22 — firmly anchored in “Extreme Fear” territory after a historic streak of 10 consecutive days below the 25 mark. The recent progression is telling: 12 → 15 → 11 → 19 → 21 → 22 → 23, showing a slow but perceptible improvement in sentiment since the floor of 11.
Historically, the best entry points for bitcoin have coincided with prolonged periods of Extreme Fear. In November 2022, after the FTX collapse, the index dropped to 8 — a nadir that preceded a rally of over 150% over the following twelve months. In August 2024, during the “yen carry trade crash,” the index fell to 17, offering a buying window of a few days before a 40% rebound. In June 2025, another plunge into Extreme Fear (score of 14) preceded a rally of $18,000 toward a new local high of $71,000.
This pattern suggests that periods of Extreme Fear have historically been accumulation opportunities for patient investors, with extreme pessimism creating oversold conditions conducive to trend reversals. However, each cycle has its own peculiarities, and the current setup — with persistent macroeconomic uncertainties — makes the outcome less certain.
The Bollinger Signal: A W-Bottom Forming?
John Bollinger, creator of the famous Bollinger Bands, recently drew attention by signaling a possible W-shaped bottom formation on bitcoin’s chart. This technical pattern, characterized by a double bottom followed by a recovery, is traditionally interpreted as a bullish reversal signal.
The indicator’s creator himself raised the possibility that the market may be approaching the end of its downtrend, adding considerable weight to this technical analysis. The Bollinger Bands, which measure market volatility, are currently showing a squeeze — a configuration that often precedes significant price movements.
Bitcoin has been oscillating between the lower band and the middle band for several weeks, a zone associated with relative price weakness. A break above the middle band (around $65,000) would be the first technical signal of a confirmed recovery. A move above $66,500 (50-day moving average) would definitively validate the technical turnaround.
Spot Bitcoin ETFs Regain Their Footing
After several weeks of negative net flows, U.S. spot Bitcoin ETFs have recorded net inflows exceeding $200 million per day for the first time since mid-May. This resurgence of institutional interest is significant on multiple fronts.
First, it demonstrates that institutional investors are using price weakness to accumulate positions, a strategy consistent with the buy-the-dip narrative that has characterized previous bull cycles. Second, the return of positive flows comes as the market is in Extreme Fear, suggesting sophisticated players perceive a disconnect between negative retail market sentiment and underlying fundamentals.
Bloomberg Intelligence analysts estimate that trading volumes for crypto investment products have increased by 35% over the past two weeks, signaling that risk appetite is gradually returning despite an uncertain macroeconomic environment.
The On-Chain Profit/Loss Paradox
While the price recovers, on-chain data tells a more nuanced story. The bitcoin holder Profit/Loss ratio has hit its lowest level in 43 months, indicating that the majority of recent transactions are occurring at a loss. This level of capitulation had not been observed since March 2023, after the U.S. banking crisis and before the start of the last Bull Market.
This apparent paradox — rising prices yet loss-making transactions — is explained by...
Analyse détaillée réservée aux membres
Notre équipe d'analystes a préparé une analyse complète avec données exclusives.
🔒 Paiement sécurisé • Stripe • Sans engagement
Déjà abonné ? Connectez-vous