Extreme Fear Takes Hold as the New Normal
The Fear & Greed (F&G) index for the cryptocurrency market displays a score of 22 for the third consecutive cycle, confirming a lasting entrenchment of Extreme Fear. After an API sequence of 21•22•23•24•27•20•22, the flat trend around 22 indicates that the market has settled into a regime of persistent extreme fear, with no visible catalyst to reverse the momentum.
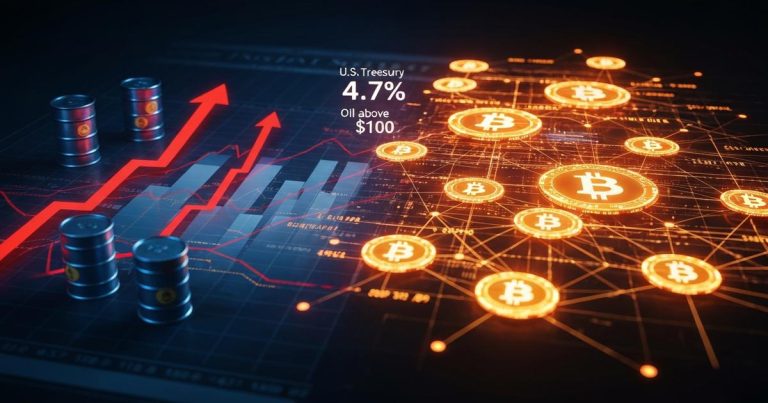
This stabilisation at historically low levels comes as Bitcoin holds around $62,000, a correlation that raises questions among analysts: the king of cryptocurrencies shows relative price stability, yet investor sentiment remains deeply negative. How can this apparent paradox be explained?
Sequence Analysis: A Plateau of Sustained Fear
The sequence of Fear & Greed Index values over the last seven 12-hour cycles is telling: 21 • 22 • 23 • 24 • 27 • 20 • 22. With the exception of a brief spike to 27, all points sit within an extremely tight range of 20 to 24. This plateau configuration is statistically rare in the index’s history.
To understand what this means, it is worth recalling how the Fear & Greed Index works. Developed by Alternative.me, this composite indicator aggregates six weighted data sources: volatility (25%), momentum and trading volume (25%), social media sentiment (15%), market surveys (15%), Bitcoin dominance (10%), and Google Trends (10%). A score of 22 means that five of these six components are simultaneously pointing toward extreme fear.
What distinguishes the current configuration is its duration. Extreme Fear has now persisted for more than seven consecutive days, a stretch not seen since the 2022 bear market. By way of comparison: in March 2020 (the COVID-19 crash), Extreme Fear lasted about 5 days before a sharp rebound in sentiment. In June 2022 (the Terra/LUNA collapse), extreme fear held for 9 days before a slow recovery.
Bitcoin at $62,000: The Paradox of Stable Price Action Under Fear
Bitcoin’s behaviour lies at the heart of the current paradox. At $62,000, BTC is trading within a historically significant price range: well above its cycle low (around $15,500 in November 2022), yet far from its all-time highs ($109,000 in January 2025). The price action shows a remarkably stable consolidation around $62,000 for several days, suggesting that sellers and buyers are balanced.
Ordinarily, stable price action is associated with a gradual return of confidence. Yet the Fear & Greed Index remains stubbornly low. Several hypotheses explain this disconnect:
First hypothesis: the ETF effect. The arrival of spot Bitcoin ETFs in the United States has profoundly altered the market structure. Institutional investment flows act as a price stabiliser, but retail sentiment — which carries significant weight in the F&G calculation — remains negative due to net outflows observed from ETFs over several weeks. On July 8, spot Bitcoin ETFs recorded net outflows of $42 million, extending a bearish trend that is affecting retail investor morale.
Second hypothesis: macroeconomic uncertainty. Interest rate outlooks, persistent inflation at 3.2% in the United States, and recession fears are weighing on risk appetite. The cryptocurrency market, classified as a risk asset, suffers from this generalised aversion.
Third hypothesis: the endogeneity of fear. Extreme Fear itself fuels Extreme Fear. When the index stays low for several days, investors interpret this persistence as a bearish signal, reinforcing their selling and risk-avoidance behaviours. This is a classic vicious circle in financial markets.
What Does an F&G of 22 Mean for Investors?
In the history of the Fear & Greed Index, scores below 25 have often coincided with interesting entry points for long-term investors. The well-known adage applies: “Be fearful when others are greedy, and greedy when others are fearful.” Warren Buffett, who popularised this maxim, applied it to traditional markets, but the principle applies just as well to cryptocurrencies.
However, this advice should be tempered. A reading of 22 does not automatically mean the market bottom has been reached. In 2022, Extreme Fear persisted for months, with scores regularly falling below 20. It was only after the market’s complete capitulation that the recovery began. The difference today lies in the relative stability of Bitcoin’s price action, which is not in freefall but in consolidation.
For investors, the central question is: is this an accumulation period or a false respite before a new leg down? Technical analysts point to the major support level at $60,000 for Bitcoin. As long as this level holds, the long-term bullish structure remains intact. A break below $60,000 would open the path toward $55,000, or even $52,000.
Catalysts That Could Break the Cycle
Several events could pull the market out of this entrenchment in Extreme Fear:
A positive regulatory catalyst. Progress in cryptocurrency regulation in the United States — notably the adoption of a clear legal framework for stablecoins or the classification of digital assets by the SEC — could revive institutional investor confidence. Several observers believe the current US administration is more favourable to crypto than the previous one, but concrete advances remain slow.
A rebound in ETF flows. If net outflows from spot Bitcoin ETFs reverse, the signal would be immediately positive for market sentiment. Institutional flows are a powerful barometer of long-term confidence.
A favourable macroeconomic event. A cut in key interest rates by the US Federal...
Analyse détaillée réservée aux membres
Notre équipe d'analystes a préparé une analyse complète avec données exclusives.
🔒 Paiement sécurisé • Stripe • Sans engagement
Déjà abonné ? Connectez-vous