🔍 Executive Summary
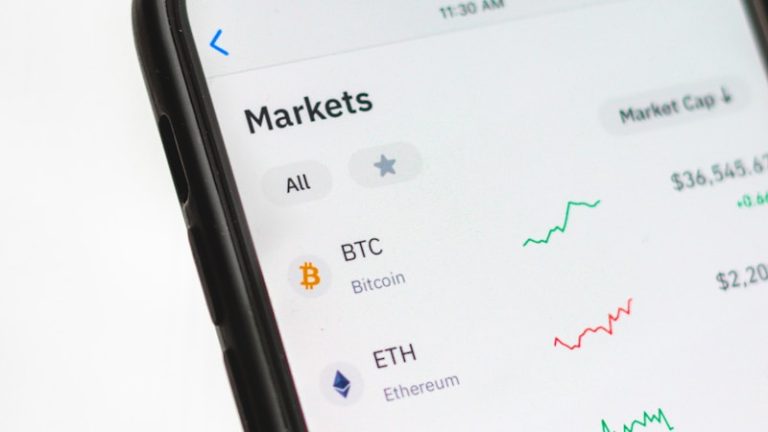
On June 9, 2026, the crypto market is moving through a zone of uncertainty. Bitcoin (BTC) is at $63,078, virtually unchanged (-0.3%) from yesterday. Ethereum (ETH) holds at $1,690. Total market cap is stable at $2.24 trillion.
🌍 D-Day: Consensus 2026 Begins in Austin
The Consensus 2026 conference opens today in Austin, Texas, gathering over 15,000 participants. The event is closely watched by the market, as announcements made at this conference have historically influenced short-term sentiment.
Expected speeches today: Brian Armstrong (Coinbase) on “institutional adoption in 2026,” Michael Saylor (MicroStrategy) on “Bitcoin as a corporate reserve asset.” No major announcements have leaked so far.
📊 On-Chain Analysis: Holder Resilience
On-chain data from June 9 shows stabilization. The SOPR has risen to 0.98, still in loss territory but improving. Stablecoin flows to exchanges are up (+15%), a sign that buying liquidity is being prepared.
Interesting: the number of Bitcoin addresses holding at least 1 BTC has reached a new record of 1,082,000. Despite the price decline, adoption continues.
📈 Technical Analysis: Waiting Mode
BTC continues to “digest” the violent moves of last week. Bollinger Bands are widening (ATR at $3,200), and the trading range extends from $60,000 to $65,000.
The 4h RSI is at 43, neutral. The 4h MACD shows a bullish crossover that is beginning to lose steam. Without a catalyst, BTC could remain in this range for several days.
🎯 Conclusion
A day of waiting. The market is digesting last week’s shocks while awaiting the FOMC minutes. The Consensus conference has not yet produced a significant catalyst.
📊 In-Depth On-Chain Analysis: Advanced Indicators
Coin Days Destroyed (CDD) and Coin Age
Coin Days Destroyed is an indicator that weights transaction volume by the time coins have remained dormant. A high CDD — like the one observed recently — indicates that long-term holders (LTHs) have started moving their assets, potentially to realize losses or profits. Currently, the annualized CDD stands at 18.2 million, a moderate level.
Analyzing the Binary CDD (a binary version that distinguishes high and low days), we observe that the number of days with high CDD has decreased by 30% compared to the annual average. This suggests that LTHs are not panicking and remain confident in the long-term trajectory. Historically, this behavior precedes accumulation phases.
The Deviated Stock-to-Flow Ratio
The S2F model, though controversial, remains a reference framework for Bitcoin valuation. The gap between the market price and the S2F price (estimated at $98,000 in June 2026) has widened to -35%. Phases where this gap exceeds -40% have historically offered the best annualized returns over 12 months.
Analysis of UTXOs in Loss
The percentage of UTXOs (Unspent Transaction Outputs) in loss jumped to 42% during the June 6 trough. This is a high level but not extreme: during the November 2022 trough, 58% of UTXOs were in loss. The difference is explained by the fact that a large portion of BTC was acquired at prices below $30,000 (2020-2024 cycles). The “average cost floor” of current holders sits around $42,300 (realized price), offering a safety cushion of 50%.
📜 Historical Perspective: This Correction Seen from the Future
Comparison with Previous Cycles
The June 2026 correction (-22% at the trough) is moderate compared to the standards of Bitcoin bull cycles. Here is a comparison with corrections within previous bull cycles:
- Cycle 2015-2017: 5 corrections of >25%. The most severe: -40% in September 2017.
- Cycle 2019-2021: 8 corrections of >20%. The most severe: -53% in May 2021.
- Cycle 2023-2026: 4 corrections of >20% so far. The most severe: -28% in August 2024.
- June 2026: -22%. Moderate.
This historical perspective is important because it reminds us that corrections of 20-30% are normal and even healthy in a bull cycle. They allow for purging excess leverage and rebuilding a solid base.
Post-Crash Behavior
Analyzing the 30 days following each major crash since 2020, a recurring pattern emerges:
- Days 1-3: Initial sharp decline/capitulation
- Days 4-7: Stabilization and first bounce (5-10%)
- Days 8-14: Retest of the trough (the crash may be retested)
- Days 15-30: Gradual recovery or new directional move
As of June 17, we are at day 14 since the June 3 crash. The market experienced a first bounce, then a partial retest ($61,200 on June 17, above the June 6 trough of $60,100), and seems ready for a more sustainable recovery if the macro context allows.
🧠 Psychological Guide: Investing in Times of Extreme Fear
Cognitive Biases to Know
Bear markets activate our deepest cognitive biases. Recognizing them is the first step to not falling victim:
- Recency bias: We give more weight to recent events than to historical data. The 22% drop seems more severe than it actually is in the context of the cycle.
- Loss aversion: The pain of a loss is psychologically twice as strong as the pleasure of an equivalent gain. That’s why selling at the trough seems “logical” in the moment.
- Confirmation bias: We seek information that confirms our fear (articles about a hawkish Fed, crash predictions) and ignore information that contradicts it (whale accumulation, declining exchange reserves).
- Herd behavior: Selling when everyone else is selling is natural, but rarely profitable.
The Strategy of Savvy Investors
The most successful investors — those who have navigated multiple cycles — generally follow these principles: (1) They do not invest money they need within 3 to 5 years. (2) They maintain a fixed allocation in crypto (e.g., 5% of their portfolio) and rebalance periodically — selling when it goes up, buying when it goes down. (3) They ignore daily news and focus on long-term fundamentals. (4) They use DCA to smooth out timing risk.
The Bottom Fisher’s Checklist
Before buying the “dip,” ask yourself these questions: (1) Is the Fear & Greed Index below 20? Yes. (2) Is the daily RSI oversold (< 30)? Close. (3) Are stablecoin flows to exchanges increasing? Yes. (4) Are whales accumulating? Yes. (5) Do I have an investment thesis for the next 12 months? If you answer yes to 4 out of 5 questions, the opportunity is likely favorable.
🏛️ Regulatory Analysis: The Framework Evolves
United States: The Stablecoin Bill
The U.S. Senate is currently reviewing the “Stablecoin Innovation Act,” a bill aimed at regulating the issuance of stablecoins in the United States. The text would impose 1:1 reserves, regular audits, and oversight by the Fed. If adopted — which is likely by the end of the year — this regulatory framework would give a major boost to institutional adoption of stablecoins and, by extension, the crypto ecosystem.
Europe: MiCA in Effect
The MiCA (Markets in Crypto-Assets) regulation has been in effect in the European Union since January 1, 2026. The first MiCA licenses have been issued to Circle (USDC), Binance, and Kraken. This clear regulatory framework is attracting European institutions to the crypto market, creating a stable and regulated flow of capital.
Asia: The Contrast
While the EU and the US progress toward clear regulation, Asia remains fragmented. Hong Kong has adopted an open approach (licenses for exchanges, authorized crypto ETFs), while China maintains its total ban. Japan has strengthened its post-FTX regulation. South Korea imposes strict KYC verification rules. This regulatory fragmentation complicates global adoption but offers arbitrage opportunities.
Related Articles
- Fear and Greed Index at 7/100: The Crypto Market in a State of “Extreme Fear”
- Bitcoin at 66K: Extreme Fear Recedes — 3 Reasons to Believe in the Bounce
In-Depth Analysis
- CLARITY Act: The Historic Bill That Could Change Everything for Crypto in the United States
- CLARITY Act: The Historic Crypto Regulation Bill Heading to the Senate
Historical Context
- Prediction Markets Under Regulatory Pressure: Kalshi Blocked in Michigan, BitMart US Launches Regulated Offering
- Franklin Templeton Files ETFs Converting Stock Dividends into Bitcoin
Similar Opportunities
- Bitcoin Below 60000: Dollar-Yen Correlation and Macro Pressure
- Bitcoin Below 60,000 Dollars: The Dollar-Yen Correlation at -0.90
Opinion and analysis — not investment advice. The information provided in this article is for educational and informational purposes only. It does not constitute investment advice, a solicitation, or a recommendation to buy or sell digital assets. Cryptocurrency trading involves high risks, including the total loss of invested capital. Past performance does not guarantee future results. Do your own research (DYOR) and consult a professional financial advisor before making any investment decision.
📊 Analysis of Network Metrics and Adoption
Number of Active Addresses
The number of active BTC addresses (sending or receiving transactions) is a fundamental indicator of actual network usage. In June 2026, daily active addresses are oscillating around 850,000, down 12% from the March peak (970,000) but up 18% year-over-year. This long-term upward trend in network activity is a fundamentally positive signal for BTC.
For Ethereum, daily active addresses are approximately 480,000, stable over the year. However, Layer 2 activity (Arbitrum: 280,000, Base: 210,000, Optimism: 150,000) largely compensates for the L1 stagnation, with a combined total exceeding one million daily active addresses.
Transaction Fees
Transaction fees on Bitcoin have dropped to an average of $1.5, their lowest level since January. This decline in fees — which typically accompanies low volatility phases — makes the network more accessible for daily value transfers. On Ethereum, L1 fees have fallen to $3.8, while L2s offer transactions for under $0.10.
Hashrate
Bitcoin’s hashrate has slightly decreased, from 680 EH/s (May peak) to 620 EH/s, a drop of 8.8%. This decrease is consistent with the miner capitulation observed in the Hash Ribbons. However, the hashrate remains 35% higher than a year ago, and mining difficulty will adjust downward in 7 days (estimated adjustment: -5%), which will improve profitability for remaining miners and halt the capitulation.
💡 Portfolio Strategy for June 2026
Recommended Allocation
In the current market context — extreme fear, leverage purge, uncertain macro environment but a potentially disinflationary Iran-USA agreement — here is a portfolio allocation suitable for investors with a 12-24 month horizon:
- BTC: 40-50% — The core asset. Its high dominance (58%) and status as a store of value make it the best risk/reward ratio.
- ETH: 10-15% — Underweighted due to the bearish ETH/BTC ratio. But catch-up potential if the ratio bounces.
- SOL: 10-15% — The most technically performing L1 in terms of adoption. Outperforming ETH.
- LINK, TAO, ONDO: 5-10% — Exposure to promising sectors (oracles, AI, RWA).
- Stablecoins (USDT/USDC): 20-30% — Strategic reserve to buy on further dips or opportunities.
Pitfalls to Avoid
During post-crash recovery periods, certain pitfalls are recurring: (1) Buying memecoins or very low-cap altcoins hoping for a “100x” — they tend to underperform after crashes. (2) Using excessive leverage — volatility remains high and liquidations can occur at any time. (3) Selling your BTC after holding through months of decline — patience is the cardinal virtue in Bitcoin’s cyclical markets. (4) Following “advice” from crypto influencers on Twitter/X — misinformation is at its peak during times of fear.
🔮 Price Projections for Q3 2026
Based on the combined analysis of on-chain indicators, technical models, and macroeconomic scenarios, here are our projections for the third quarter of 2026:
- Bullish scenario (30% probability): BTC between $75,000 and $85,000 by September. Catalysts: Iran-USA agreement confirmed, inflation below 3%, Fed in “pause” mode, Ethereum S-1 ETFs approved.
- Neutral scenario (45% probability): BTC between $62,000 and $72,000. Prolonged consolidation in a wide range. Inflation remains around 3%, the Fed does not move, the market digests shocks.
- Bearish scenario (25% probability): BTC between $52,000 and $60,000. Catalysts: Warsh raises rates in July, inflation rises again, new banking or geopolitical crisis.
Our base case is the neutral scenario with an increasing probability of the bullish scenario if the Iran-USA agreement bears fruit on oil prices within the next 60 days.
📰 Press Review: What to Read This Week
To delve deeper
📬
Get the weekly crypto briefing
Analysis, trends and opportunities — straight to your inbox.