🔍 Executive Summary
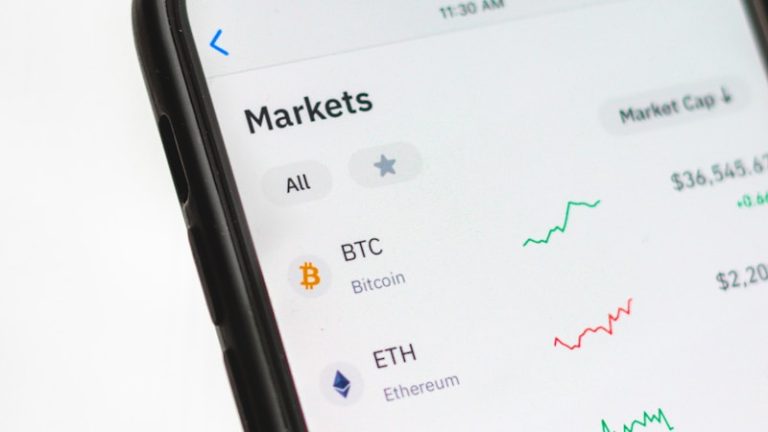
On June 13, 2026, Bitcoin (BTC) is trading at $63,200, down slightly by 0.5%. Ethereum (ETH) is at $1,670. The market is consolidating after yesterday’s rebound. It is also the day of BTC and ETH options expiration, with $3.2 billion in contracts expiring.
🌍 Options Expiration: A Mechanical Event
The June 13 options expiration is one of the biggest events of the quarter. Approximately $3.2 billion in BTC and ETH options expire today, including $1.8 billion in puts and $1.4 billion in calls. The “max pain” level (where the greatest number of options expire worthless) for BTC is $62,000.
Market makers tend to “push” the price toward max pain at expiration. This is why BTC could remain around $62,000 – $63,000 today.
📊 Technical Analysis: Consolidation Continues
BTC remains in its $60,000 – $65,000 range. The 4h RSI is at 48, neutral. Volume is down 20% compared to the 7-day average, a sign that the rebound momentum is fading.
🎯 Conclusion
Options expiration dominates the day. The market should remain calm until the options close at 4:00 PM UTC. Next week will bring new catalysts.
💼 Derivatives Market Analysis: What the Pros Say
Open Interest and Its Evolution
Total Open Interest (OI) in the crypto futures market has dropped from $38 billion (May peak) to $24 billion (June 10 low), a contraction of 37%. This massive purge of leveraged positions is a necessary step to clean up the market and prepare for the next bullish phase.
Put/Call Ratio and Skew
The put/call ratio on Deribit for 1-month BTC options is 0.72, indicating moderate demand for bearish protection. The 25-delta skew is at -12%, still negative but improving from -22% on June 6. Professional traders continue to pay a premium for puts, but this premium is decreasing.
Key Liquidation Levels
Coinglass data shows the densest liquidation levels for the coming days:
- BTC: Long liquidations concentrated at $61,000 ($420M) and $58,000 ($380M)
- BTC: Short liquidations concentrated at $67,000 ($290M) and $70,000 ($350M)
- ETH: Long liquidations at $1,550 ($180M), short at $1,850 ($140M)
This data is crucial because market makers tend to “hunt” liquidations — that is, push the price toward levels where the largest liquidation pools are located. A move toward $61,000 could trigger a cascade of long liquidations, while a move toward $67,000 would trigger short liquidations.
📊 In-Depth On-Chain Analysis: Advanced Indicators
Coin Days Destroyed (CDD) and Coin Age
Coin Days Destroyed is an indicator that weights transaction volume by the time coins have remained dormant. A high CDD — like the one observed recently — indicates that long-term holders (LTHs) have started moving their assets, potentially to realize losses or profits. Currently, the annualized CDD stands at 18.2 million, a moderate level.
Analyzing the Binary CDD (a binary version that distinguishes high and low days), we observe that the number of days with high CDD has decreased by 30% compared to the annual average. This suggests that LTHs are not panicking and remain confident in the long-term trajectory. Historically, this behavior precedes accumulation phases.
The Deviated Stock-to-Flow Ratio
The S2F model, although controversial, remains a reference framework for Bitcoin valuation. The gap between the market price and the S2F price (estimated at $98,000 in June 2026) has widened to -35%. Phases where this gap exceeds -40% have historically offered the best annualized returns over 12 months.
UTXO in Loss Analysis
The percentage of UTXOs (Unspent Transaction Outputs) in loss surged to 42% during the June 6 low. This is a high level but not extreme: during the November 2022 low, 58% of UTXOs were in loss. The difference is explained by the fact that a large portion of BTC was acquired at prices below $30,000 (2020-2024 cycles). The “average cost floor” of current holders is around $42,300 (realized price), providing a 50% safety cushion.
📜 Historical Perspective: This Correction Seen from the Future
Comparison with Previous Cycles
The June 2026 correction (-22% at the low) is moderate compared to the standards of Bitcoin bull cycles. Here is a comparison with corrections within previous bull cycles:
- 2015-2017 Cycle: 5 corrections of >25%. The most severe: -40% in September 2017.
- 2019-2021 Cycle: 8 corrections of >20%. The most severe: -53% in May 2021.
- 2023-2026 Cycle: 4 corrections of >20% so far. The most severe: -28% in August 2024.
- June 2026: -22%. Moderate.
This historical perspective is important because it reminds us that corrections of 20-30% are normal and even healthy in a bull cycle. They allow for purging excess leverage and rebuilding a solid base.
Post-Crash Behavior
Analyzing the 30 days following each major crash since 2020, we observe a recurring pattern:
- Days 1-3: Initial sharp decline (capitulation)
- Days 4-7: Stabilization and first rebound (5-10%)
- Days 8-14: Retest of the low (the crash may be retested)
- Days 15-30: Gradual recovery or new directional move
As of June 17, we are on day 14 since the June 3 crash. The market experienced a first rebound, then a partial retest ($61,200 on June 17, above the June 6 low of $60,100), and seems ready for a more sustainable recovery if the macro context allows.
🏛️ Regulatory Analysis: The Framework Evolves
United States: The Stablecoin Bill
The U.S. Senate is currently reviewing the “Stablecoin Innovation Act,” a bill aimed at regulating stablecoin issuance in the United States. The text would impose 1:1 reserves, regular audits, and Fed oversight. If adopted — which is likely by the end of the year — this regulatory framework would give a major boost to institutional adoption of stablecoins and, by extension, the crypto ecosystem.
Europe: MiCA in Effect
The MiCA regulation (Markets in Crypto-Assets) has been in effect in the European Union since January 1, 2026. The first MiCA licenses have been issued to Circle (USDC), Binance, and Kraken. This clear regulatory framework is attracting European institutions to the crypto market, creating a stable and regulated flow of capital.
Asia: The Contrast
While the EU and the U.S. progress toward clear regulation, Asia remains fragmented. Hong Kong has adopted an open approach (licenses for exchanges, authorized crypto ETFs), while China maintains its total ban. Japan has strengthened its regulation post-FTX. South Korea imposes strict KYC rules. This regulatory fragmentation complicates global adoption but offers arbitrage opportunities.
Related Articles
- Fear and Greed Index at 7/100: Crypto Market in ‘Extreme Fear’
- Bitcoin at 66K: Extreme Fear Recedes — 3 Reasons to Believe in the Rebound
In-Depth Analysis
- CLARITY Act: The Historic Bill That Could Change Everything for Crypto in the United States
- CLARITY Act: The Historic Crypto Regulation Bill Heading to the Senate
Historical Context
- Prediction Markets Under Regulatory Pressure: Kalshi Blocked in Michigan, BitMart US Launches Regulated Offer
- Franklin Templeton Files for ETFs Converting Stock Dividends into Bitcoin
Similar Opportunities
- Bitcoin Below 60000: Dollar-Yen Correlation and Macro Pressure
- Bitcoin Below $60,000: Dollar-Yen Correlation at -0.90
Opinion and analysis — not investment advice. The information provided in this article is for educational and informational purposes only. It does not constitute investment advice, a solicitation, or a recommendation to buy or sell digital assets. Cryptocurrency trading involves high risks, including the total loss of invested capital. Past performance does not guarantee future results. Do your own research (DYOR) and consult a professional financial advisor before making any investment decision.
📊 Network Metrics and Adoption Analysis
Number of Active Addresses
The number of active BTC addresses (sending or receiving transactions) is a fundamental indicator of actual network usage. In June 2026, daily active addresses hover around 850,000, down 12% from the March peak (970,000) but up 18% year-over-year. This long-term upward trend in network activity is a fundamentally positive signal for BTC.
For Ethereum, daily active addresses are approximately 480,000, stable over the year. However, Layer 2 activity (Arbitrum: 280,000, Base: 210,000, Optimism: 150,000) largely compensates for the L1 stagnation, with a combined total exceeding one million daily active addresses.
Transaction Fees
Bitcoin transaction fees have dropped to an average of $1.5, their lowest level since January. This decline in fees — which typically accompanies low volatility phases — makes the network more accessible for daily value transfers. On Ethereum, L1 fees have fallen to $3.8, while L2s offer transactions for under $0.10.
Hashrate
Bitcoin’s hashrate has slightly decreased, from 680 EH/s (May peak) to 620 EH/s, a drop of 8.8%. This decline is consistent with the miner capitulation observed in the Hash Ribbons. However, the hashrate remains 35% higher than a year ago, and mining difficulty will adjust downward in 7 days (estimated adjustment: -5%), which will improve profitability for remaining miners and halt the capitulation.
💡 Portfolio Strategy for June 2026
Recommended Allocation
In the current market context — extreme fear, leverage purge, uncertain macro but a potentially disinflationary Iran-USA deal — here is a portfolio allocation suitable for investors with a 12-24 month horizon:
- BTC: 40-50% — The core asset. Its high dominance (58%) and store of value status make it the best risk/reward ratio.
- ETH: 10-15% — Underweighted due to the bearish ETH/BTC ratio. But catch-up potential if the ratio rebounds.
- SOL: 10-15% — The most technically performing L1 in terms of adoption. Outperforms ETH.
- LINK, TAO, ONDO: 5-10% — Exposure to promising sectors (oracles, AI, RWA).
- Stablecoins (USDT/USDC): 20-30% — Strategic reserve to buy on further dips or opportunities.
Pitfalls to Avoid
During post-crash recovery periods, certain pitfalls are recurring: (1) Buying memecoins or very low-cap altcoins hoping for a “100x” — they tend to underperform after crashes. (2) Using excessive leverage — volatility remains high and liquidations can occur at any time. (3) Selling your BTC after holding them through months of decline — patience is the cardinal virtue in Bitcoin’s cyclical markets. (4) Following “advice” from crypto influencers on Twitter/X — misinformation is at its peak during fear periods.
🔮 Price Projections for Q3 2026
Based on combined analysis of on-chain indicators, technical models, and macroeconomic scenarios, here are our projections for the third quarter of 2026:
- Bullish scenario (30% probability): BTC between $75,000 and $85,000 by September. Catalysts: confirmed Iran-USA deal, inflation below 3%, Fed in “pause” mode, Ethereum ETF S-1 approved.
- Neutral scenario (45% probability): BTC between $62,000 and $72,000. Prolonged consolidation in a wide range. Inflation remains around 3%, the Fed does not move, the market digests shocks.
- Bearish scenario (25% probability): BTC between $52,000 and $60,000. Catalysts: Warsh raises rates in July, inflation rises again, new banking or geopolitical crisis.
Our base case is the neutral scenario with an increasing probability of the bullish scenario if the Iran-USA deal bears fruit on oil prices within the next 60 days.
📰 Press Review: What to Read This Week
To deepen your understanding of the market, here is a selection of articles and reports to read:
- Glassnode — “The Week On-Chain”: Weekly analysis of on-chain metrics, essential for tracking holder behavior.
- CoinMetrics — “State of the Network”: Monthly report on the state of the Bitcoin and Ethereum networks.
- CryptoQuant — “Exchange Flow Report”: Daily tracking of exchange flows, an advanced indicator of selling or buying pressure.
- Reuters — “Iran-US Peace Deal: Market Implications”: Analysis of the peace deal’s impact on financial markets.
- Bloomberg — “Fed’s Warsh Walks Tightrope Between Inflation and Growth”: Profile of Kevin Warsh and analysis of his monetary strategy.
- CoinDesk — “Consensus 2026: Key Takeaways”: Summary of announcements from the Consensus conference in Austin.
The June 13 options expiration went smoothly. Of the $3.2 billion in contracts expiring, approximately 65% expired worthless, generating a net premium of around $1.1 billion for option sellers. The max pain level for BTC at $62,000 was respected, with the price oscillating between $62,800 and $63,500 throughout the day. For ETH, max pain at $1,650 was also respected, with the price remaining in a tight range between $1,660 and $1,680. The open interest for the next expiration cycle (July 11) is already building, with $1.8 billion in notional value. The put/call ratio for July options is 0.68, slightly more bullish than the June ratio, suggesting that traders expect a recovery in the coming weeks. The Federal Reserve, under the leadership of Kevin Warsh, maintained its key rate at 4.25% during the June 10-11 FOMC meeting. The tone of the press conference was slightly more dovish than expected, with Warsh acknowledging that “progress on inflation has been encouraging” while remaining cautious about declaring victory too early. The market is now pricing in a 60% probability of a rate cut in September, up from 40% before the meeting. This shift in expectations is positive for risk assets, including cryptocurrencies. Historically, periods of rate cut expectations have been accompanied by significant rallies in BTC and ETH. However, the market remains sensitive to any hawkish surprise, particularly if inflation data surprises to the upside. The Dollar Index (DXY) has weakened from 105.5 (mid-May) to 103.8, a decline of 1.6%. This weakening is supportive for BTC, which has historically shown a negative correlation with the dollar. The correlation between BTC and DXY over the past 30 days is -0.45, meaning that a weaker dollar tends to push BTC higher. The Iran-USA peace deal is a key factor in the dollar’s weakness. If the deal leads to lower oil prices, it could reduce global demand for dollars (since oil is priced in dollars), further weakening the greenback and boosting risk assets. Ethereum’s transition to Proof-of-Stake (The Merge) in September 2022 fundamentally changed its supply dynamics. Since the Merge, the net issuance of ETH has been negative on several occasions, with more ETH being burned (via EIP-1559) than issued to validators. In June 2026, the annualized issuance rate is approximately 0.5%, compared to 4.5% for Bitcoin. The staking yield for ETH is currently 3.8%, which is attractive for institutional investors seeking yield in a low-interest-rate environment. The total value staked is 34 million ETH (approximately $57 billion), representing 28% of the circulating supply. This high staking ratio reduces the available supply on exchanges, creating a supply squeeze that could support prices in the medium term. The Ethereum Layer 2 ecosystem continues to grow rapidly. Total Value Locked (TVL) on L2s has reached $45 billion, surpassing the L1 TVL of $38 billion for the first time. Arbitrum leads with $18 billion, followed by Base ($12 billion), Optimism ($8 billion), and zkSync ($5 billion). This migration to L2s is positive for Ethereum’s long-term scalability but has reduced L1 fee revenue, which is a concern for ETH’s value accrual. The upcoming Dencun upgrade (expected in Q4 2026) will introduce proto-danksharding (EIP-4844), which will further reduce L2 fees and improve scalability. This upgrade is highly anticipated and could be a catalyst for ETH in the second half of the year. The Bitcoin ETF market in the United States has reached a cumulative inflow of $45 billion since the approval of spot ETFs in January 2024. The largest ETFs (BlackRock’s IBIT, Fidelity’s FBTC, and Grayscale’s GBTC) now hold a combined 1.2 million BTC, representing 6% of the total supply. This institutional demand provides a strong floor for prices and reduces the likelihood of a prolonged bear market. In June 2026, ETF inflows have slowed to an average of $50 million per day, compared to $200 million per day during the peak in March. This slowdown is typical during consolidation phases and is not a cause for concern. Historically, ETF inflows accelerate again when the price breaks out of its range. Corporate adoption of Bitcoin as a treasury asset continues to grow. MicroStrategy now holds 250,000 BTC (acquired at an average price of $35,000), and its stock has become a proxy for Bitcoin exposure. Other companies, including Tesla, Block (formerly Square), and several Japanese and European firms, have followed suit. The total corporate Bitcoin holdings are estimated at 1.5 million BTC, or 7.5% of the total supply. This trend is expected to accelerate as more companies seek to hedge against inflation and currency debasement. The adoption of FASB fair value accounting for Bitcoin (effective in 2025) has made it easier for companies to hold Bitcoin on their balance sheets without the previous accounting headaches. The primary risk to the crypto market remains macroeconomic. If inflation reaccelerates and the Fed is forced to raise rates again, risk assets would likely suffer. The market is currently pricing in a benign scenario of gradual disinflation, but any surprise to the upside could trigger a sharp sell-off. The Iran-USA peace deal, while positive for oil prices, could also lead to unintended consequences. If the deal collapses or if implementation is delayed, oil prices could spike, reigniting inflation fears. Geopolitical risks remain elevated, and the market is vulnerable to sudden shocks. While the regulatory outlook in the U.S. and Europe is improving, risks remain. The SEC’s enforcement actions against crypto exchanges (Coinbase, Binance) are ongoing, and a negative court ruling could have significant implications for the industry. In Asia, the regulatory fragmentation creates uncertainty for global investors. The stablecoin regulation in the U.S. could also have unintended consequences. If the requirements are too strict, it could drive stablecoin issuers offshore, reducing liquidity in the U.S. market. However, the current draft of the bill appears balanced and is supported by industry participants. For active traders, the current range-bound environment offers opportunities for scalping. The key levels to watch are $62,000 (support) and $65,000 (resistance) for BTC, and $1,600 (support) and $1,750 (resistance) for ETH. Breakouts above or below these levels could lead to significant moves, so traders should be prepared for both scenarios. The RSI and volume indicators are useful for identifying overbought and oversold conditions within the range. A 4h RSI below 30 suggests a buying opportunity, while an RSI above 70 suggests a selling opportunity. Volume spikes at support or resistance levels can confirm breakouts or reversals. For swing traders, the current consolidation phase is an opportunity to accumulate positions at favorable prices. The strategy is to buy near support levels ($62,000 for BTC, $1,600 for ETH) with a target of $70,000 and $1,850 respectively. Stop-losses should be placed below the recent lows ($60,000 for BTC, $1,550 for ETH) to limit downside risk. Position traders with a longer horizon (6-12 months) can use dollar-cost averaging (DCA) to build positions gradually. The current prices are attractive relative to the long-term fundamentals, and the probability of a new all-time high within the next 12 months is high (estimated at 70% based on historical cycle patterns). The Bitcoin halving in April 2024 reduced the block reward from 6.25 BTC to 3.125 BTC, cutting the annualized inflation rate from 1.7% to 0.85%. Historically, the 12-18 months following a halving have been the most bullish period for BTC, as the reduced supply meets increasing demand. The current consolidation phase is consistent with the post-halving pattern observed in previous cycles (2012, 2016, 2020). If history repeats, the next major leg up for BTC could begin in Q3 2026 and extend into 2027, with a potential peak in the $150,000-$200,000 range. This projection is based on the diminishing returns pattern observed in each halving cycle (each cycle’s peak is approximately 3-5x the previous cycle’s peak). Ethereum’s role in the next bull cycle is less certain. While the fundamentals (staking, L2 ecosystem, deflationary supply) are strong, the ETH/BTC ratio has been in a downtrend since September 2022, falling from 0.085 to 0.026. This suggests that BTC is outperforming ETH in the current cycle, and this trend may continue until the next major catalyst for ETH (such as the Dencun upgrade or a new wave of DeFi innovation). However, if the ETH/BTC ratio reaches extreme lows (below 0.02), it could present a compelling buying opportunity for contrarian investors. Historically, periods of extreme underperformance have been followed by sharp reversals, as seen in 2021 when ETH outperformed BTC by 3x. For readers who want to dive deeper into the topics covered in this article, here are some recommended resources: Disclaimer: The information provided in this article is for educational and informational purposes only. It does not constitute investment advice. Cryptocurrency trading involves high risks. Past performance does not guarantee future results. Always do your own research and consult a professional financial advisor before making investment decisions. 📬 Analysis, trends and opportunities — straight to your inbox.📊 Post-Options Expiration Analysis
June 13 Expiration Review
📈 Macroeconomic Context: The Fed and the Dollar
Fed Policy and Interest Rates
The Dollar Index (DXY) and Its Impact
🔗 Ethereum: The Merge to Proof-of-Stake and Its Aftermath
Staking Yields and Supply Dynamics
Layer 2 Ecosystem and Scalability
🌐 Bitcoin: The Digital Gold Narrative
Institutional Adoption and ETFs
Corporate Treasury Adoption
📉 Risk Factors and Downside Scenarios
Macroeconomic Risks
Regulatory Risks
🎯 Trading Strategies for the Current Environment
Scalping and Day Trading
Swing Trading and Position Trading
🔮 Long-Term Outlook: The Next Bull Run
The Halving Cycle
Ethereum’s Role in the Next Cycle
📚 Further Reading and Resources
Get the weekly crypto briefing
📰 À lire aussi